PROJECT / HR-ATTRITION
HR Employee Attrition and Workforce Analytics Dashboard
An interactive workforce analytics dashboard built with Python, Pandas, Plotly, Streamlit and scikit-learn to explore employee attrition patterns, evaluate a baseline risk model, and surface data-informed retention questions.
01 / PROBLEM
Employee attrition can affect workforce continuity and hiring costs. HR teams need ways to explore patterns in workforce data and identify areas that may warrant further investigation, without treating a model score as a decision about an individual.
02 / APPROACH
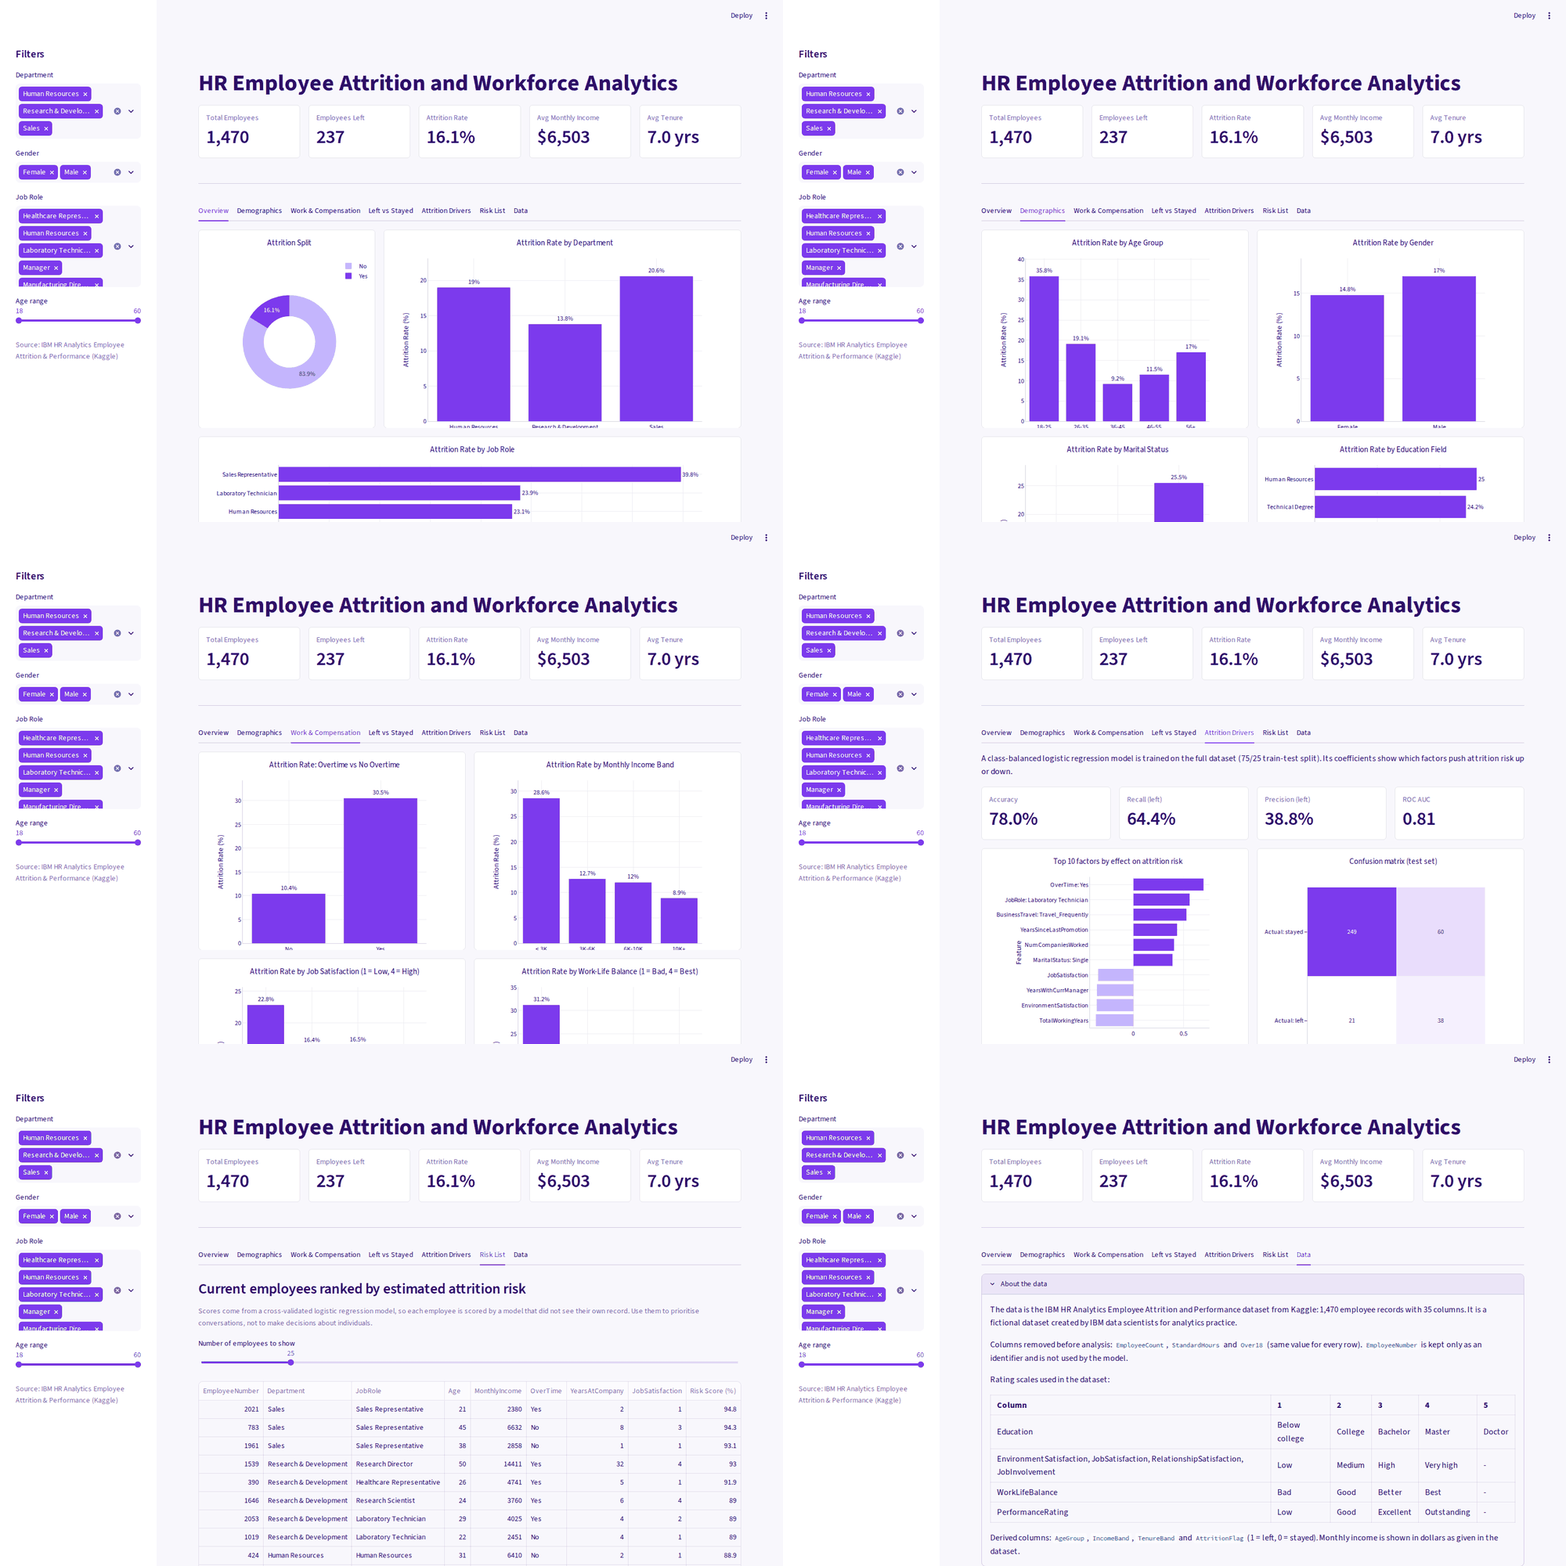
An interactive analytics dashboard built around the IBM HR Analytics Employee Attrition & Performance dataset. It combines exploratory analysis, visual comparisons, a baseline Logistic Regression model, and a filterable risk-analysis view.
03 / KEY FEATURES
- Interactive overview of workforce size and attrition patterns
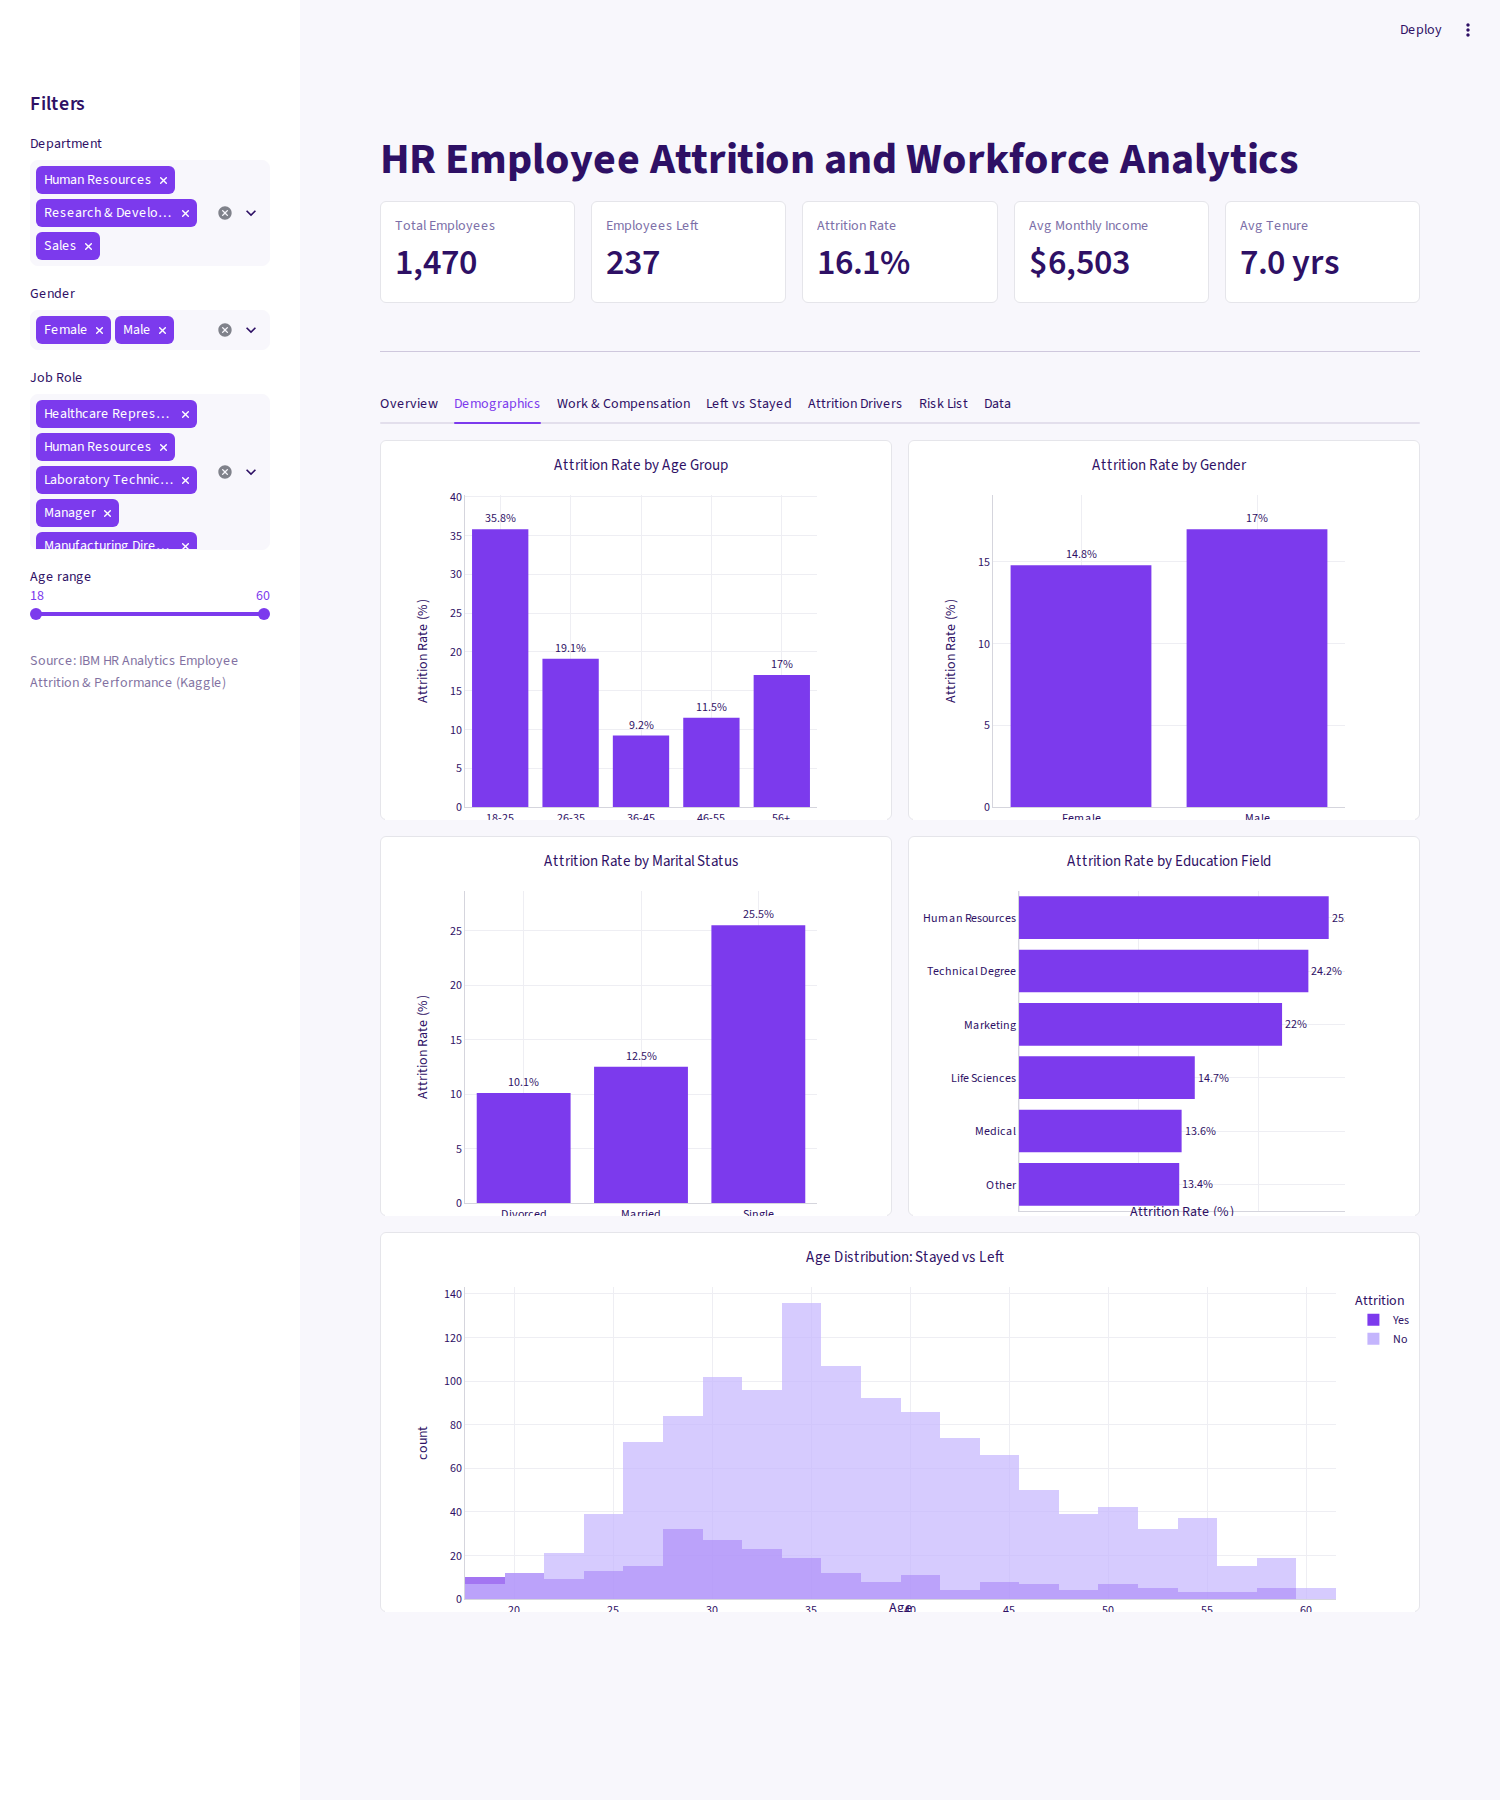
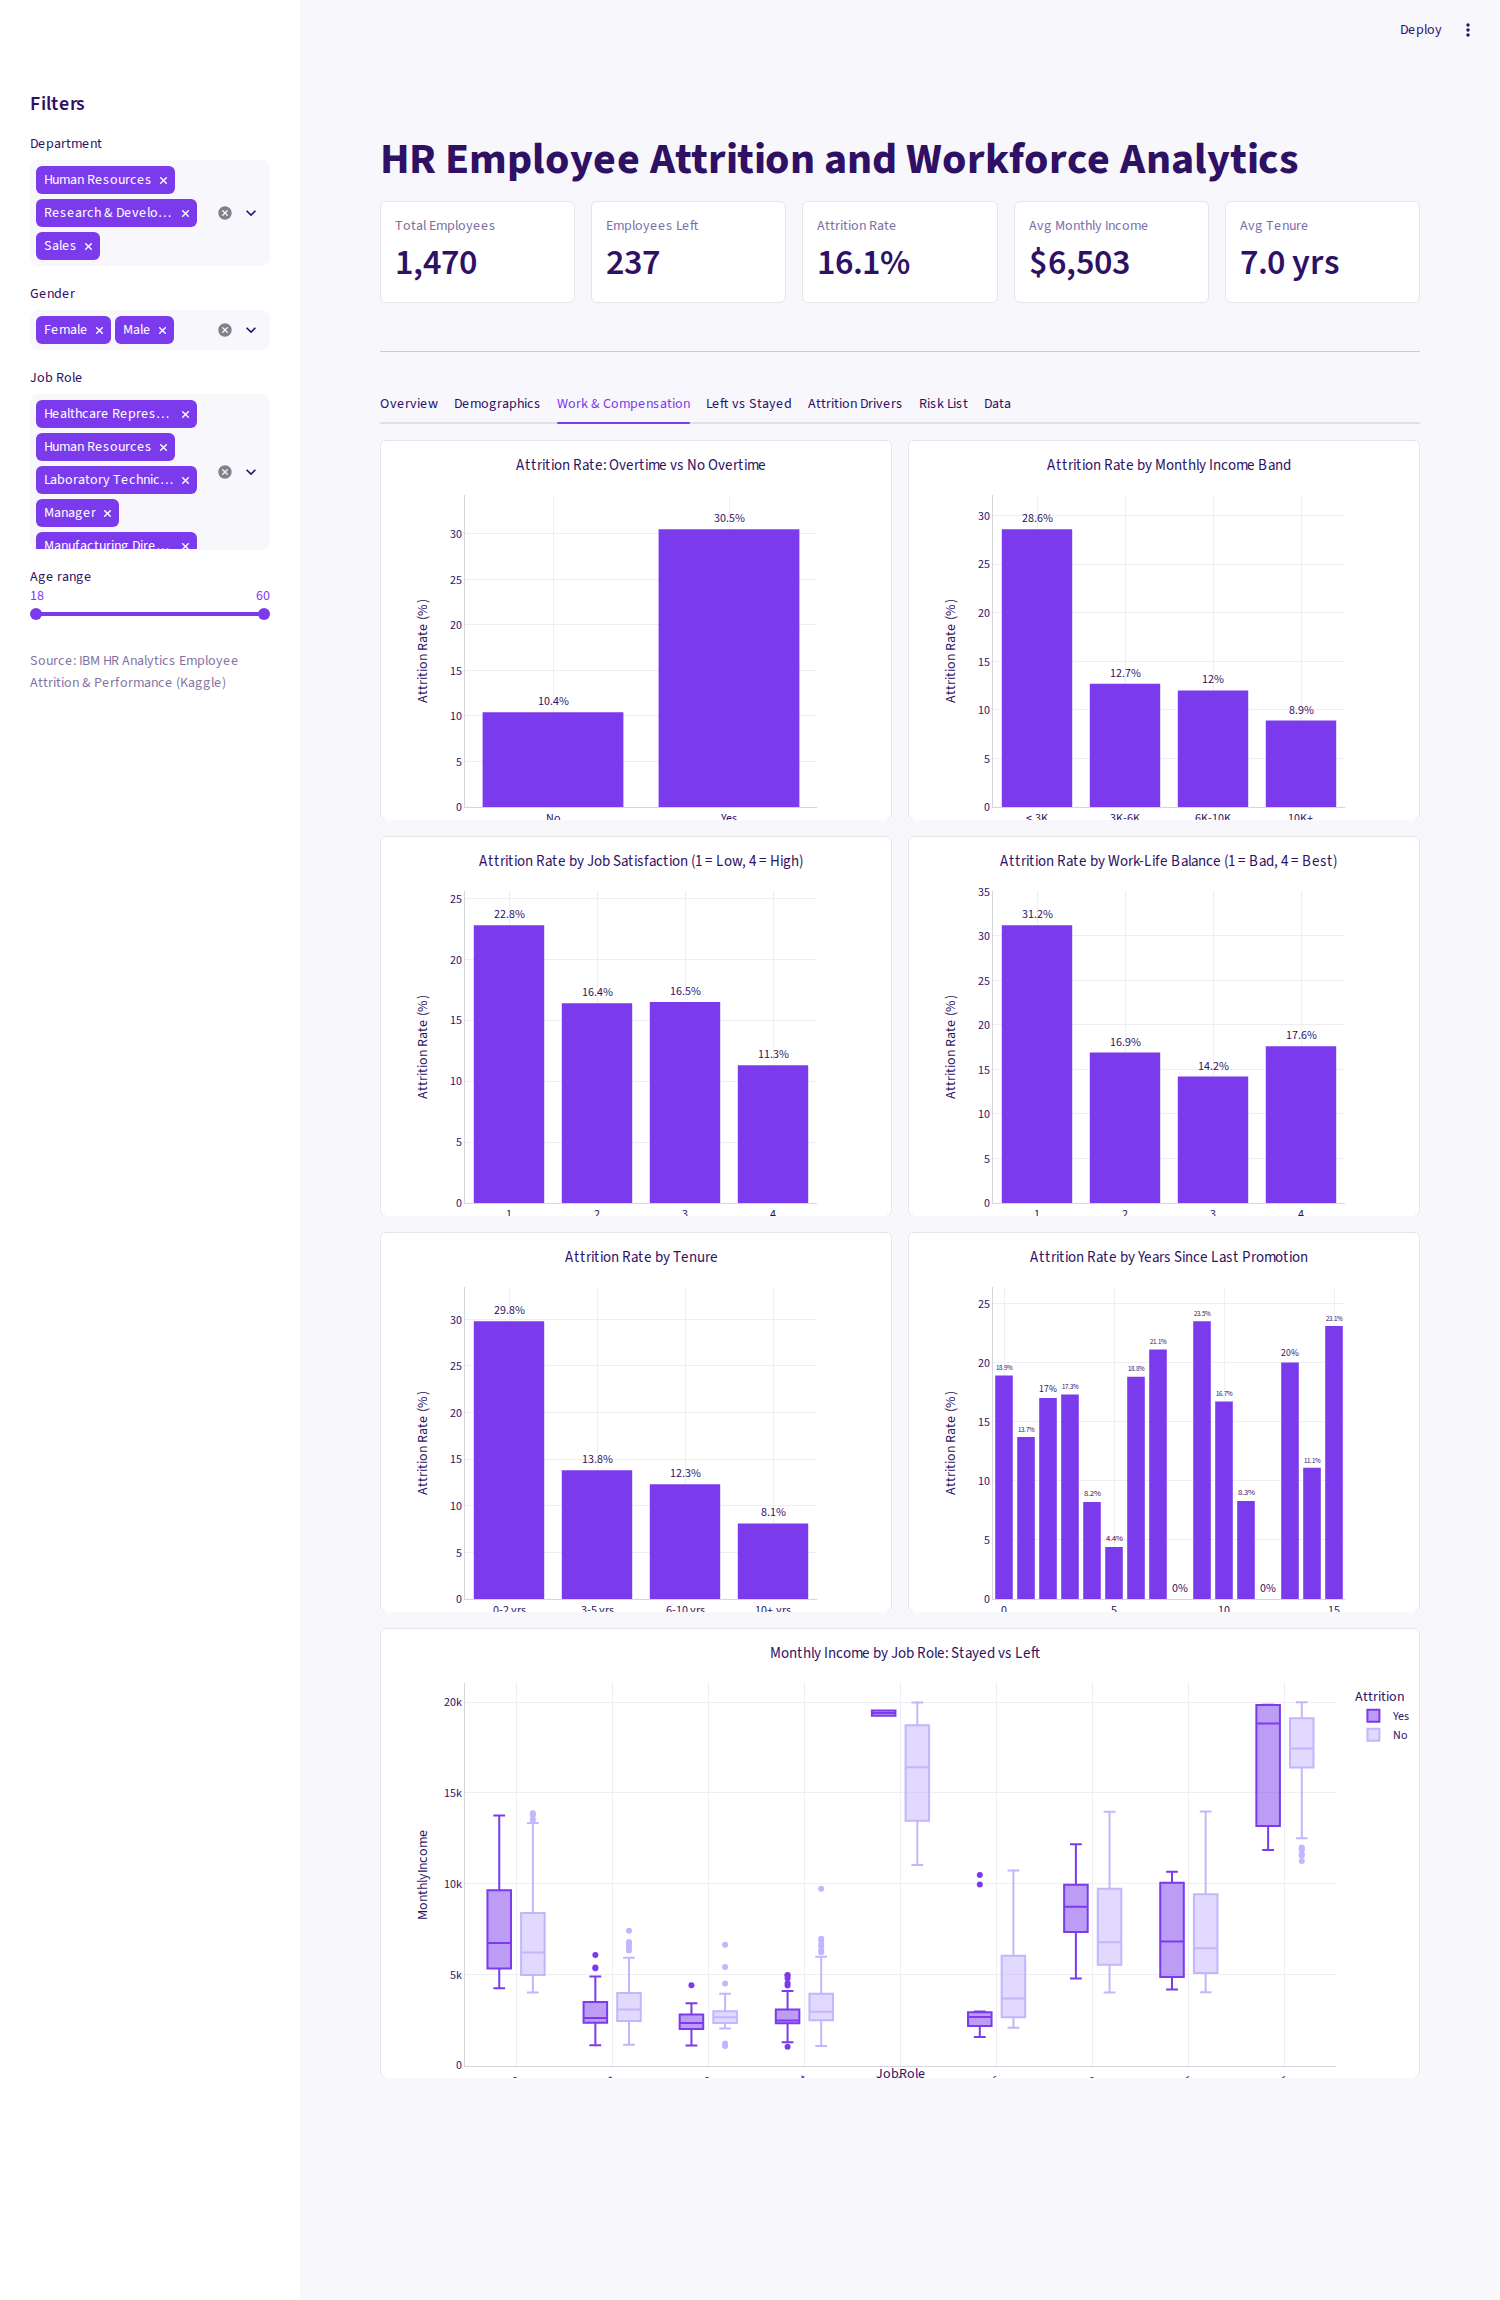
- Demographic, work, compensation and tenure analysis
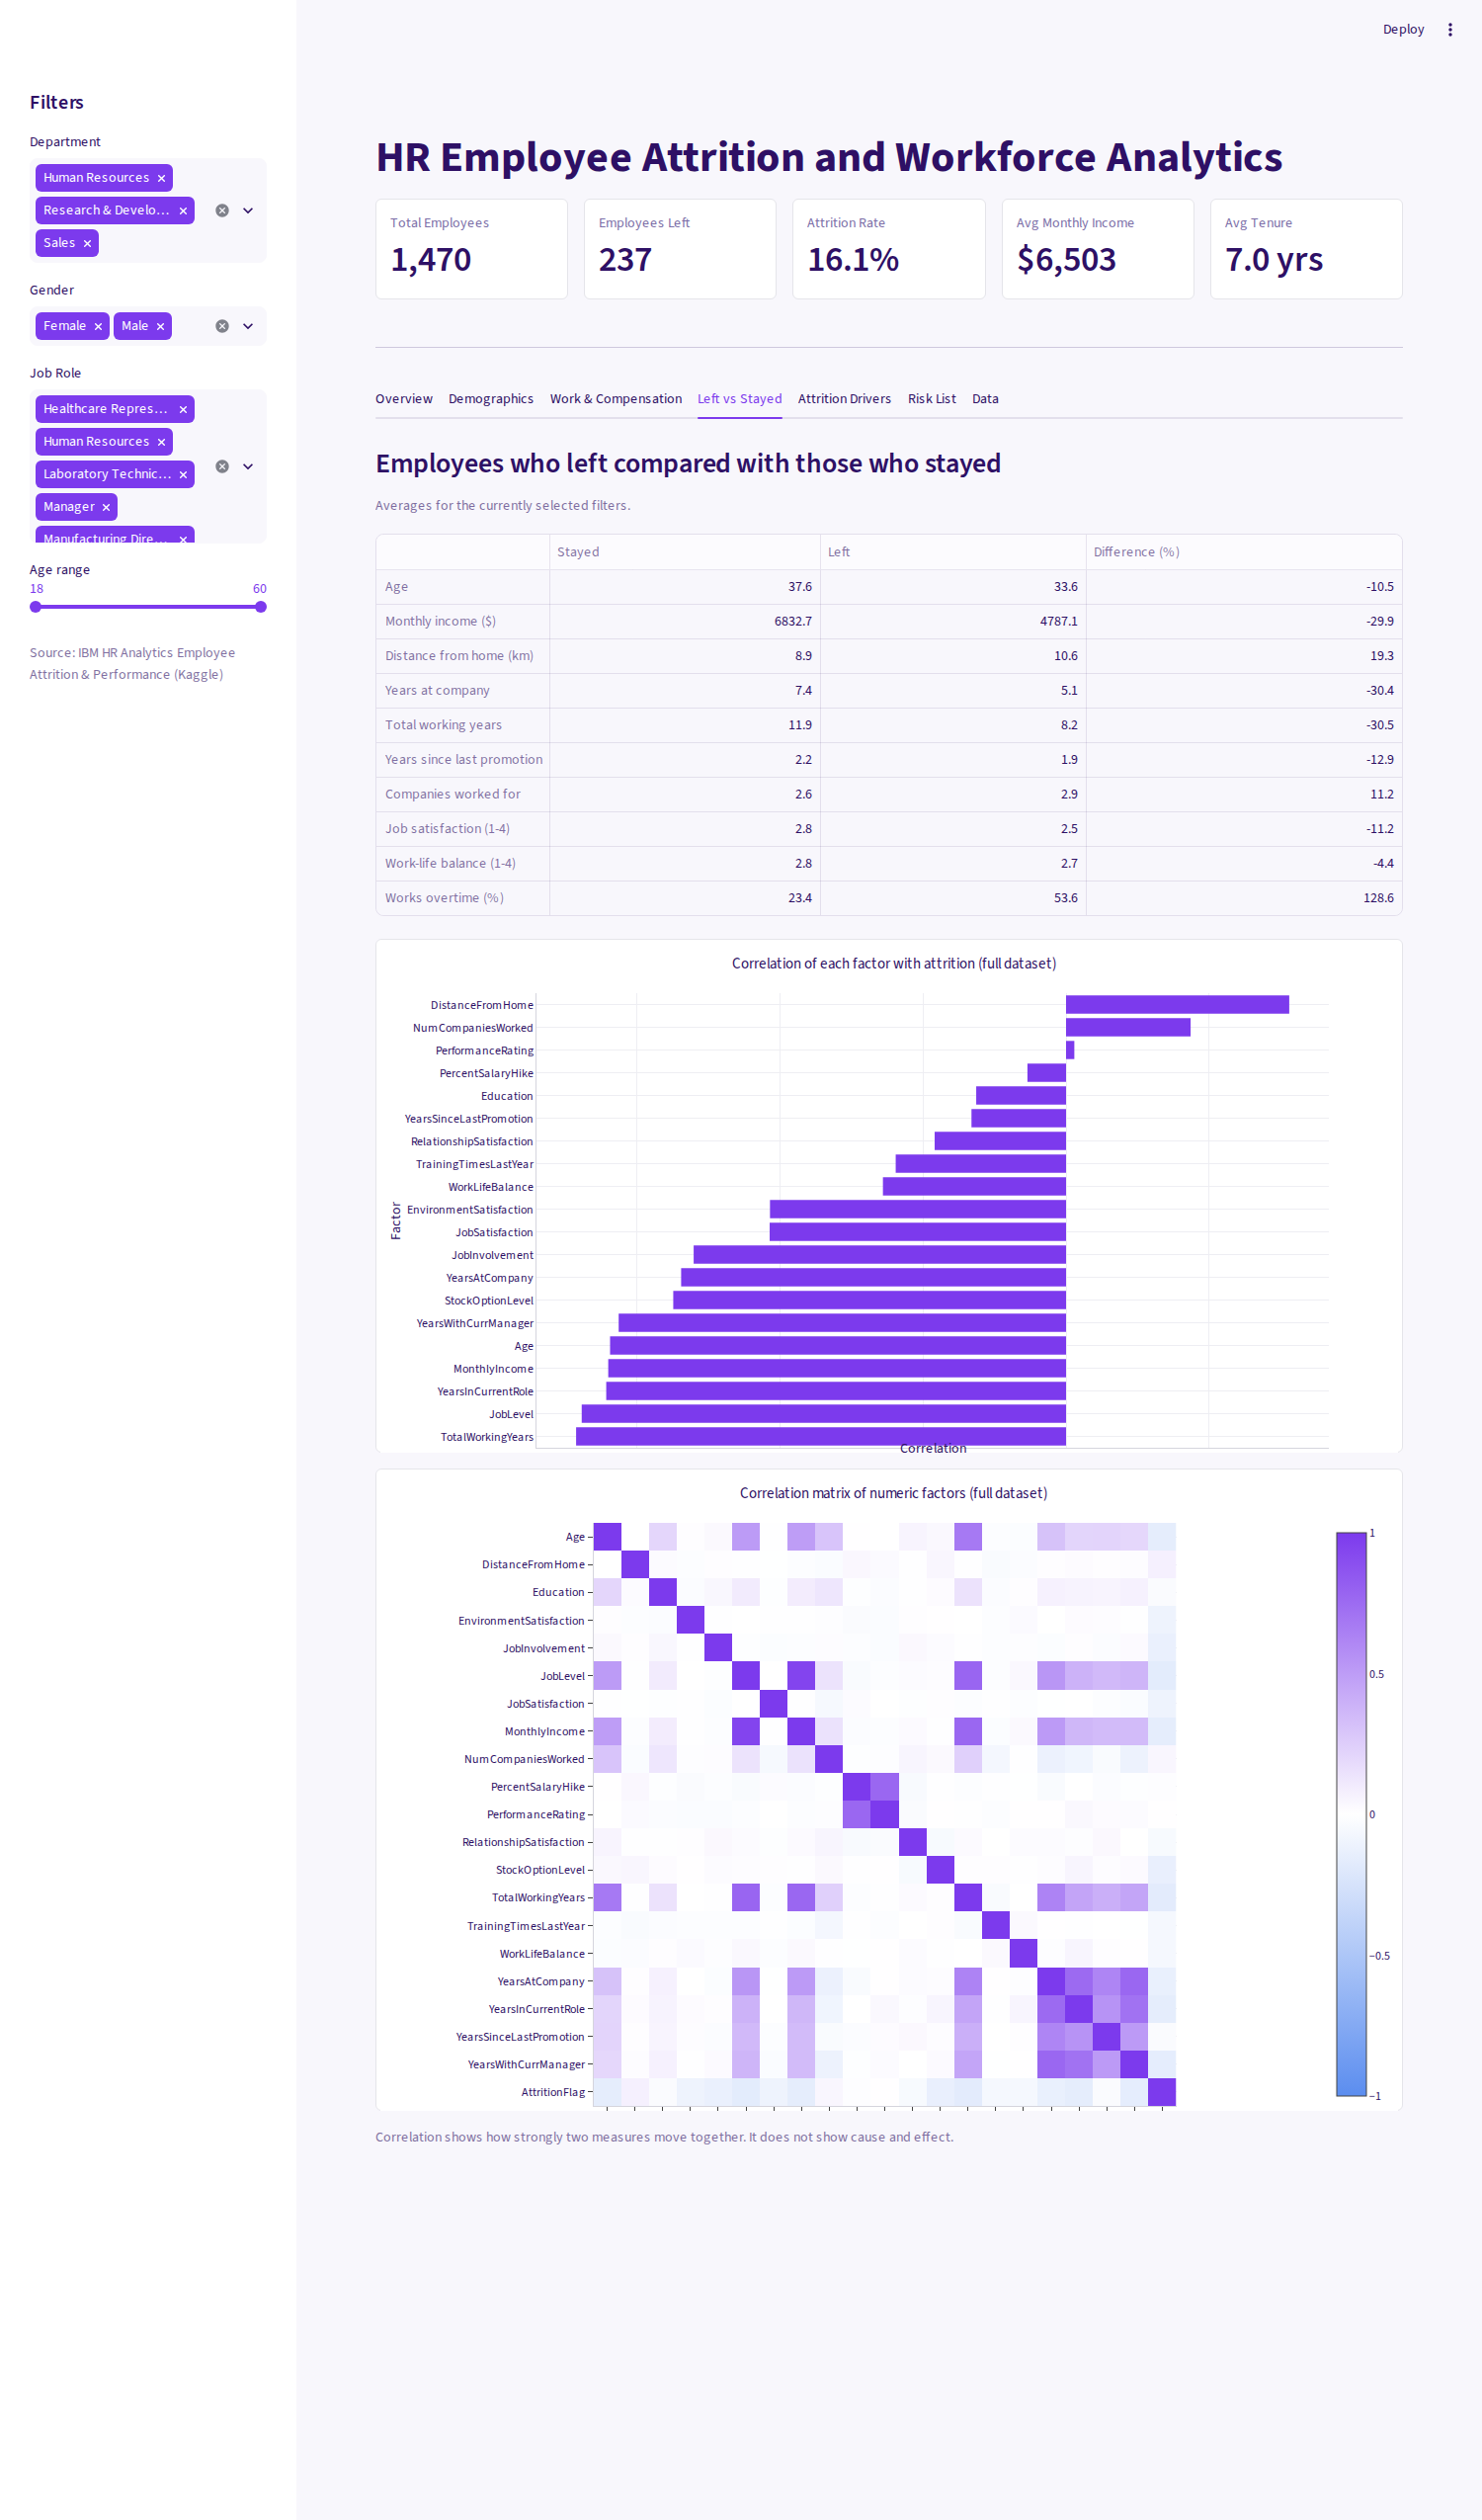
- Left-versus-stayed comparisons and exploration of associated factors
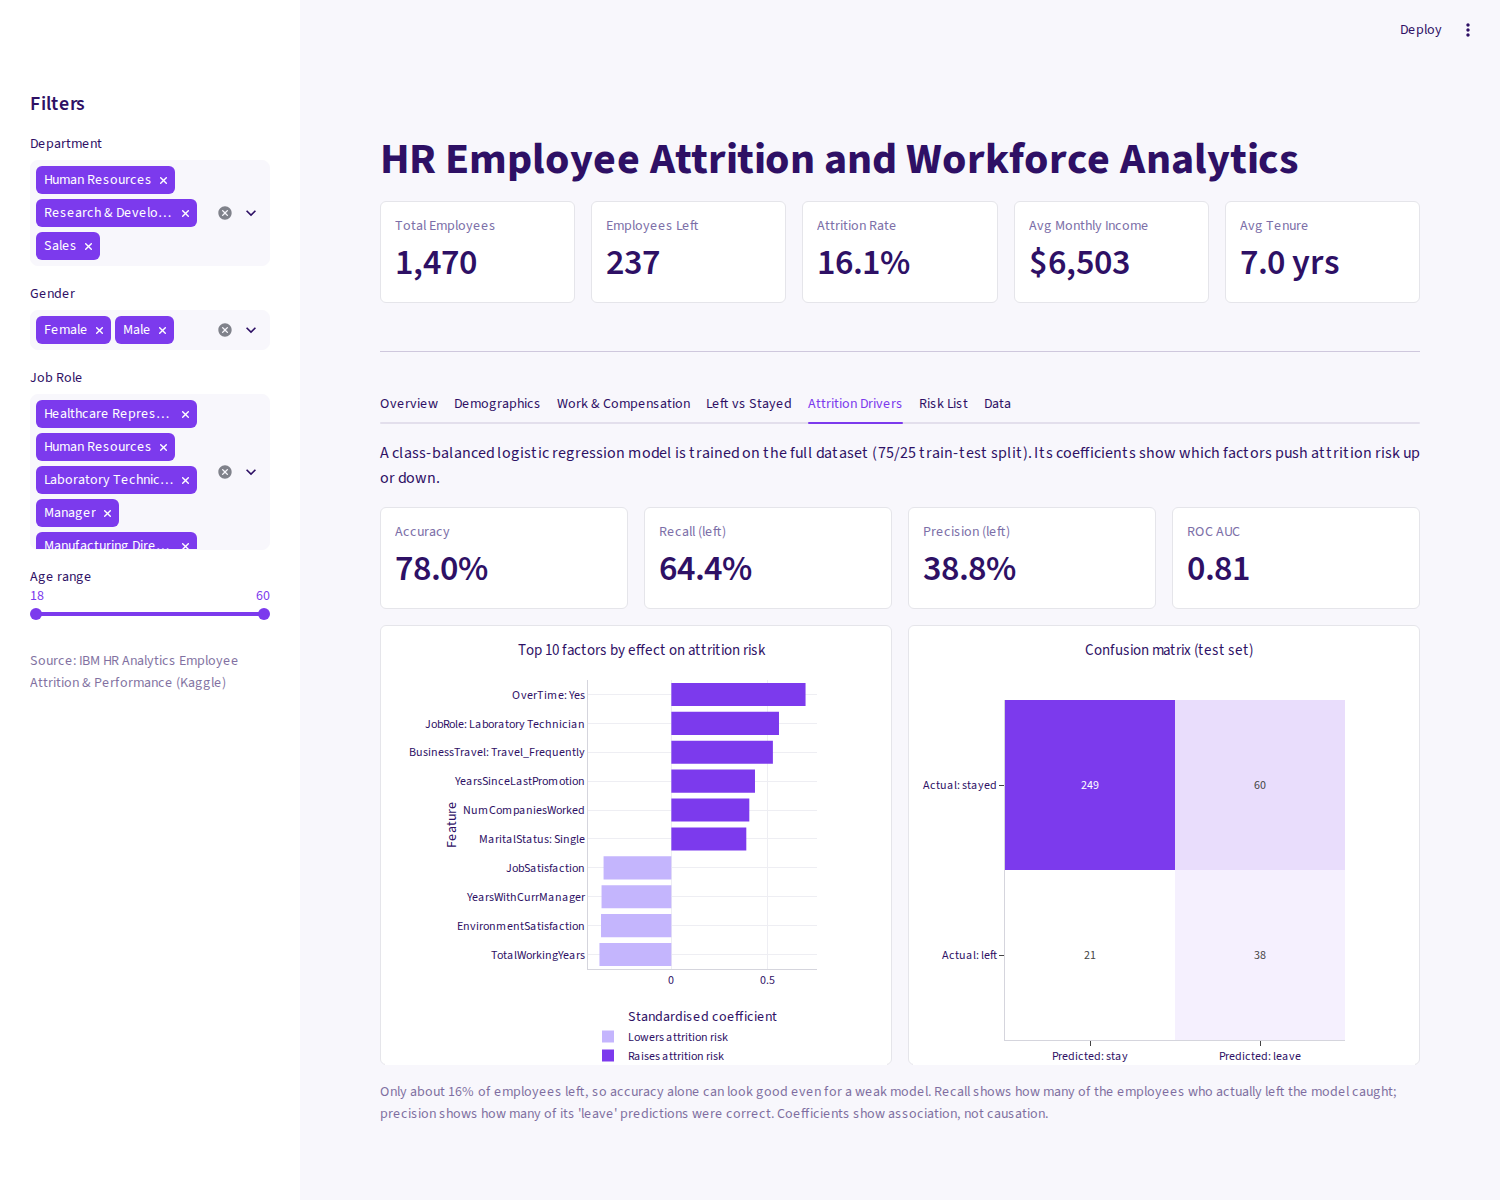
- Class-balanced Logistic Regression baseline with a stratified train/test split
- Model evaluation using accuracy, precision, recall and ROC-AUC
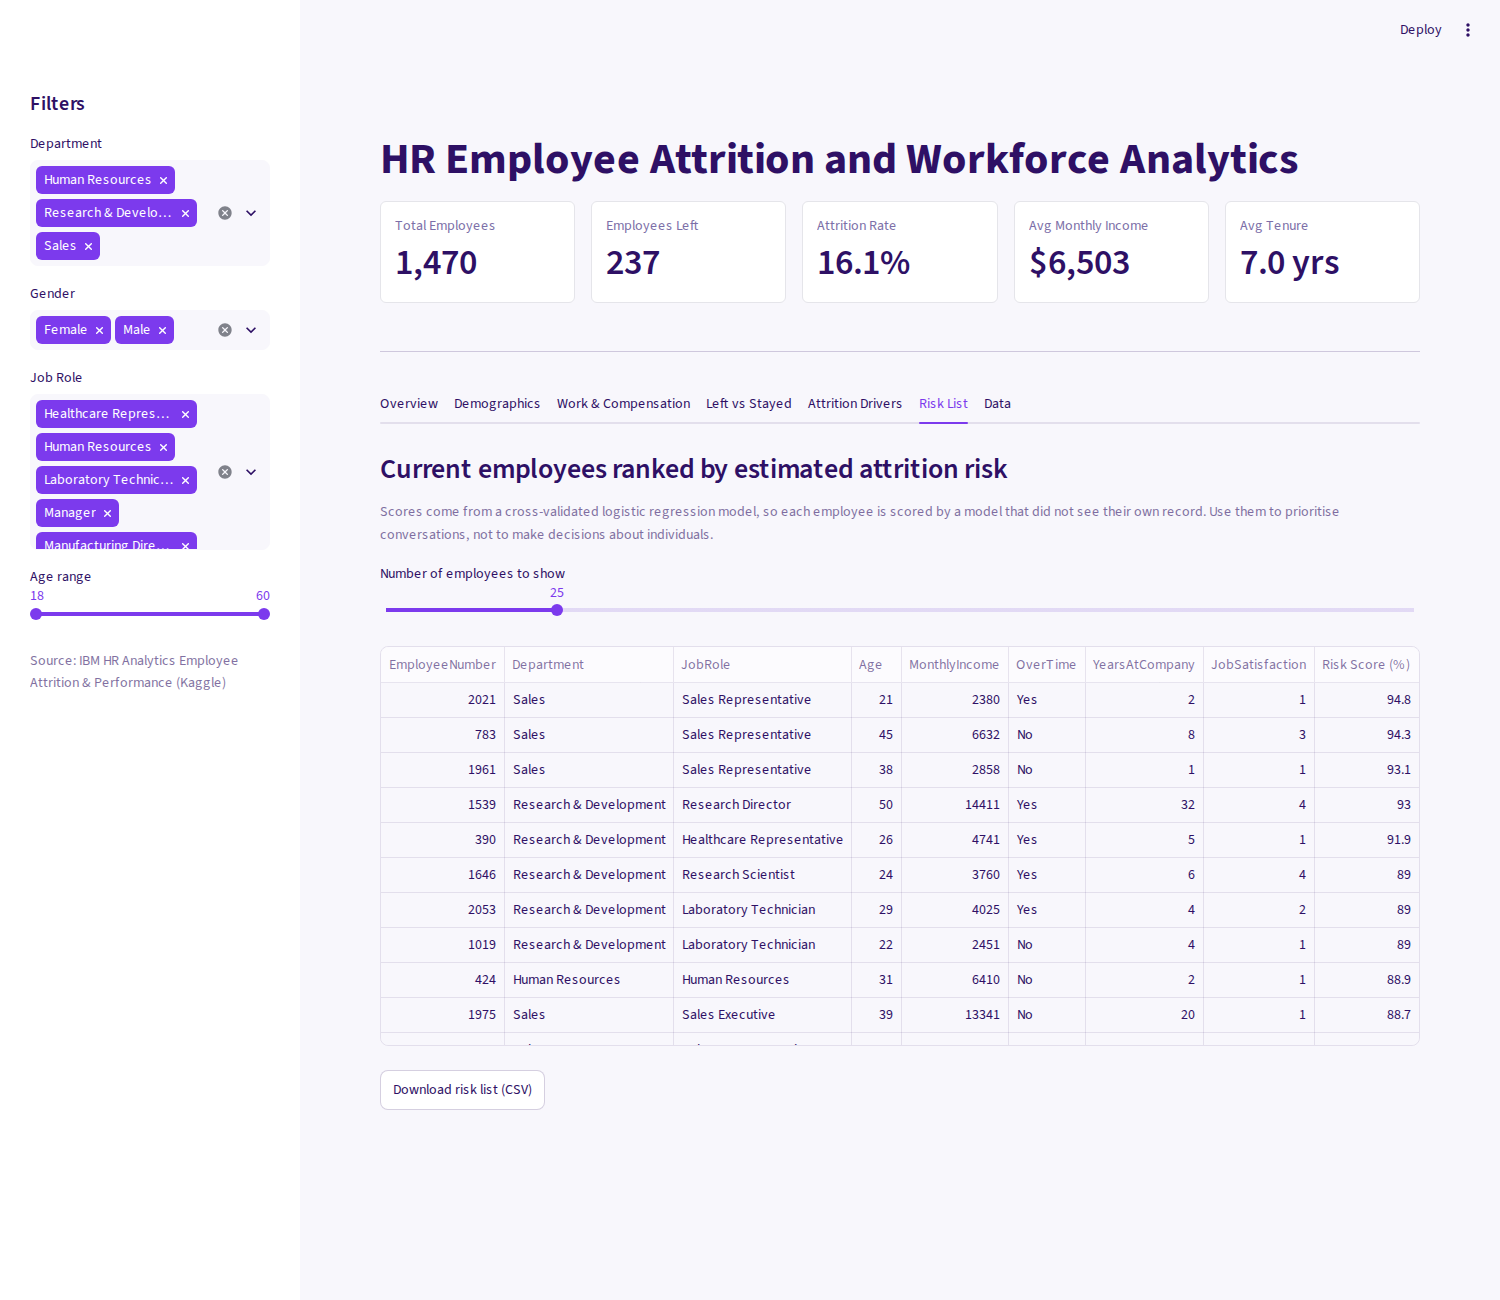
- Filterable risk-analysis list with CSV export
- Data-informed retention questions and recommendations
TECHNOLOGY
ARCHITECTURE
HR analytics dataset → cleaning and feature engineering → exploratory analysis → Logistic Regression baseline → model evaluation → interactive Streamlit dashboard and exportable risk-analysis view.
IMPLEMENTATION
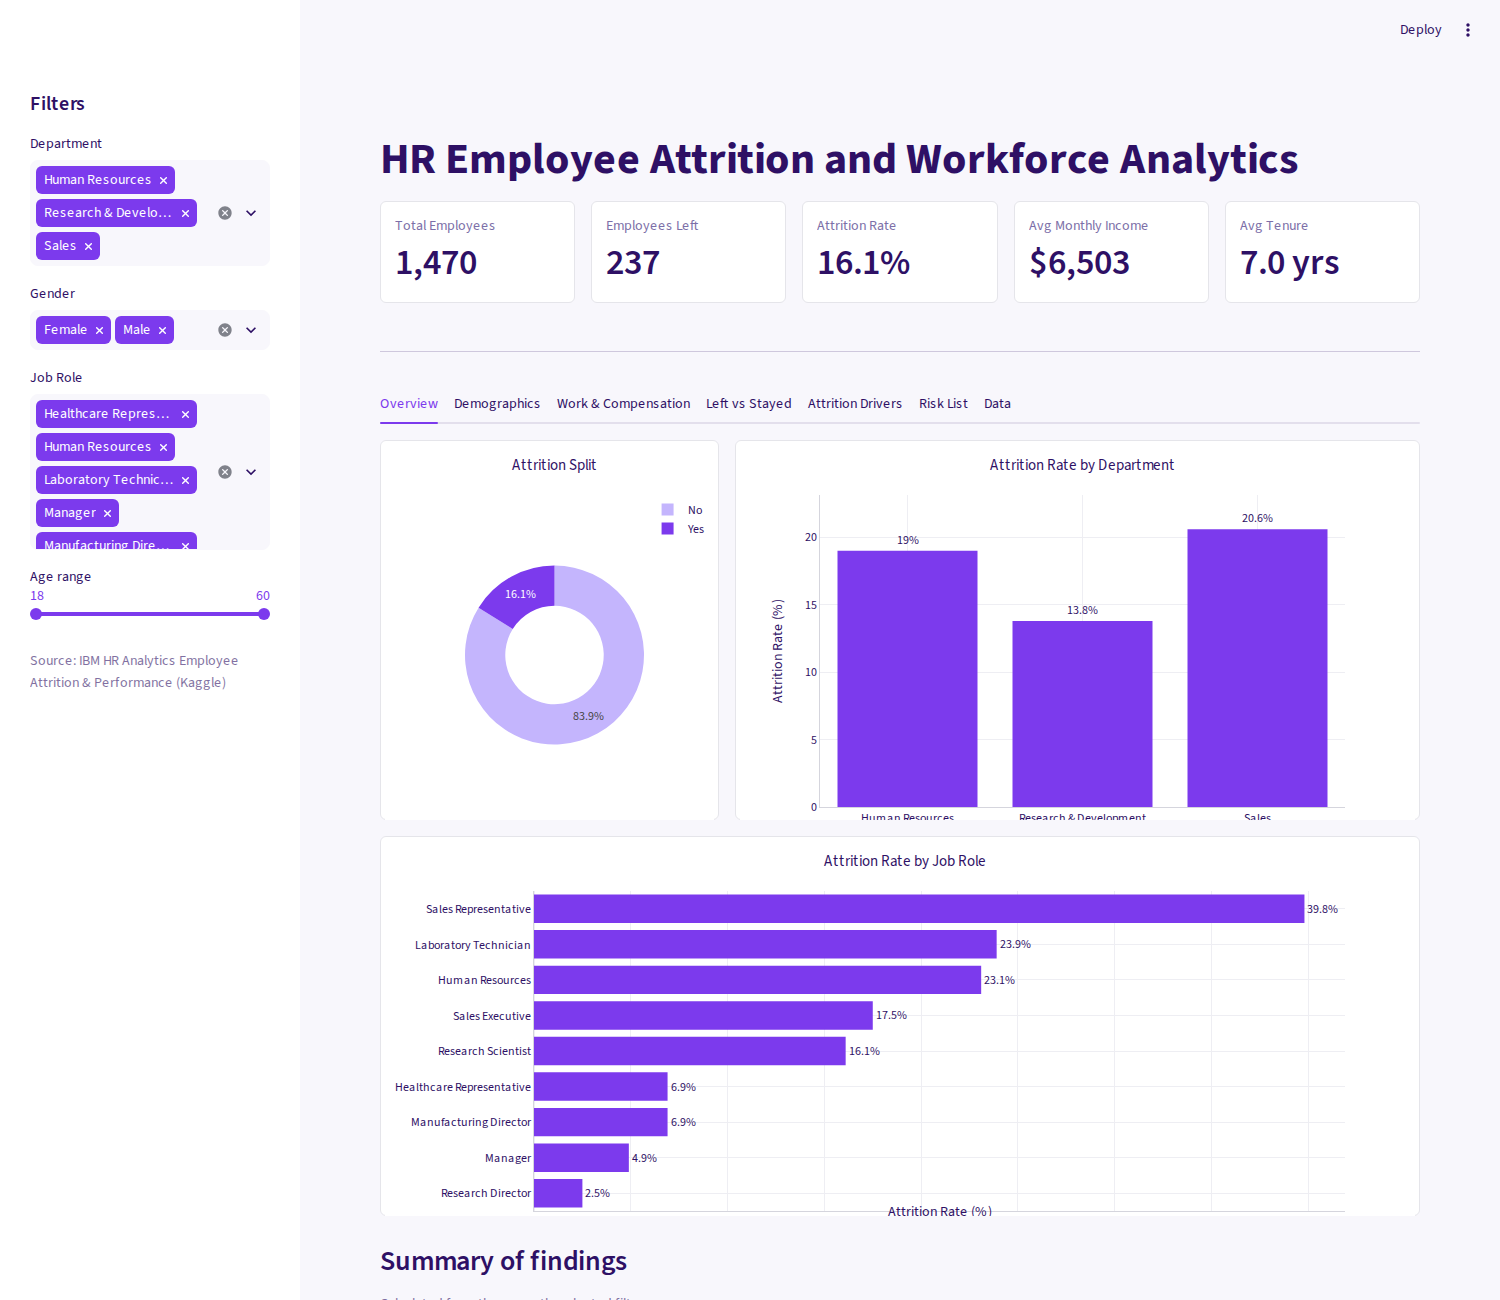
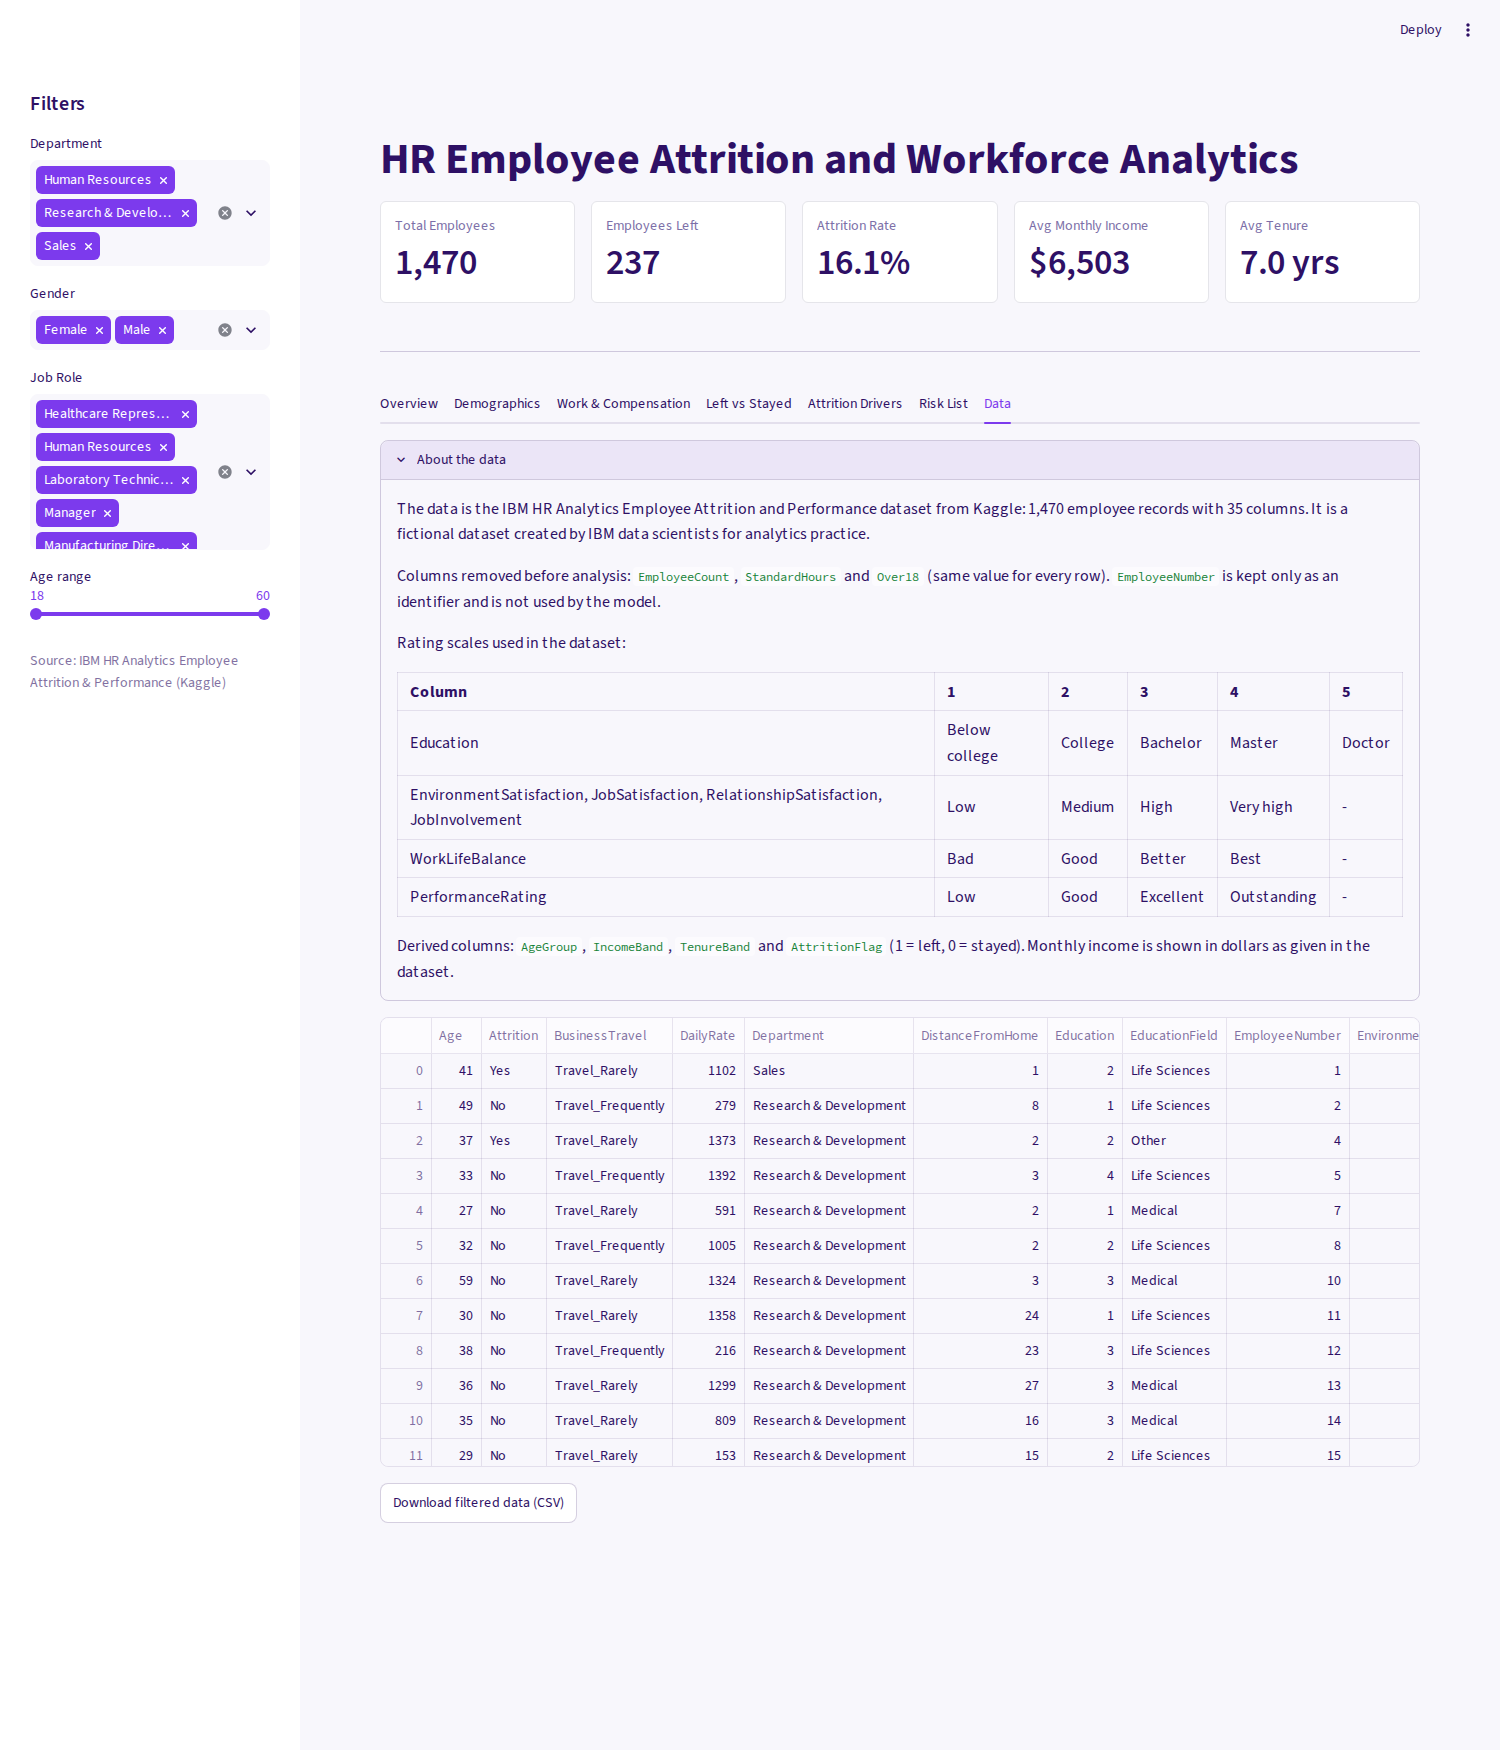
The project prepares workforce features for analysis, explores attrition patterns through interactive visualizations, and evaluates a class-balanced Logistic Regression baseline using a stratified 75/25 train/test split. The dashboard organizes findings into focused views for workforce overview, demographics, compensation, attrition drivers, risk analysis and raw data.
OUTCOMES & NOTES
On the documented evaluation split, the baseline model achieved 78.0% accuracy, 64.4% recall, 38.8% precision and 0.81 ROC-AUC. These results describe this dataset and split only; they do not establish real-world predictive performance.
Uses the fictional IBM HR Analytics Employee Attrition & Performance dataset (1,470 employee records). Observed relationships do not establish causation. Risk scores should support review and conversation—not automated employment decisions or judgments about individual employees.
NEXT / SELECTED WORK
Keep exploring.
02 / SELECTED WORK
Ideas made
tangible.
A selection of explorations across learning, audio analysis, workforce data and urban systems.